How to Find Wasted Time at Work With a Calendar Time Audit
If workdays feel busy but important work is not moving forward, a calendar time audit can reveal the gap. Review what your schedule shows, identify one avoidable drain, and make a small change for the next week.
This article focuses on using calendar data to find wasted time at work. It is not about filling every minute or blaming yourself for a busy week. It is about making better decisions with a clear record of meetings, focus work, administration, and unplanned requests.
What counts as wasted time at work?
“Wasted” does not necessarily mean an activity has no value. A meeting, email, or task can be necessary and still take more time than it should. Look for time that does not match the outcome you need.
Common examples include:
Recurring meetings with no clear purpose or decision
Context switching between small, unplanned requests
Administrative work that could be batched or simplified
Focus blocks repeatedly broken up by meetings
Travel or preparation time that was not considered when planning
A calendar cannot judge the value of your work. It can, however, show the pattern clearly enough for you to ask better questions.
Step 1: Record work in a few consistent categories
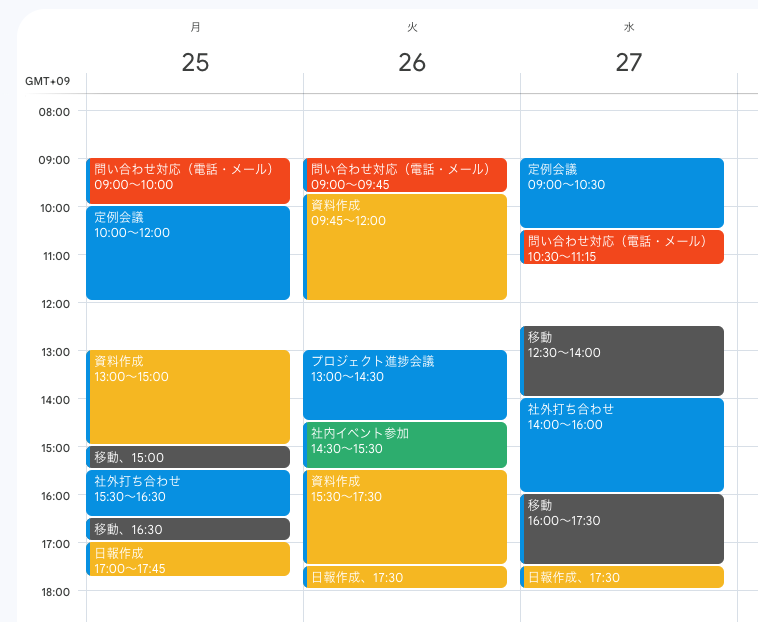
Use Google Calendar or Outlook Calendar to record your work in broad categories. Start simple: four to six labels are enough for a useful audit.
A practical set of labels might be:
Meetings: team meetings, 1:1s, client calls
Focus work: writing, analysis, design, development
Communication: email, chat, follow-ups
Admin: expenses, reporting, systems, scheduling
Travel: commuting or client visits
Planning: prioritization and project preparation
Use the same words each time. If one event says “Client call” and another says “Customer meeting,” they may be harder to review as one activity. A simple pattern such as Meeting | Client A or Focus | Proposal draft keeps detail while preserving a consistent category.
Step 2: Review a completed week, not a planned one
Choose the previous week and adjust any calendar blocks that are clearly different from what happened. The aim is an honest approximation, not minute-by-minute time tracking.
Then ask:
Which activity took the largest share of my week?
Did I protect enough uninterrupted time for my highest-priority work?
What repeatedly interrupted planned work?
Which meetings or tasks had little visible outcome?
A single week is a starting point. Repeating the review for a few weeks makes recurring problems easier to distinguish from an unusual deadline or event.
Step 3: Visualize your work time with Kotomil
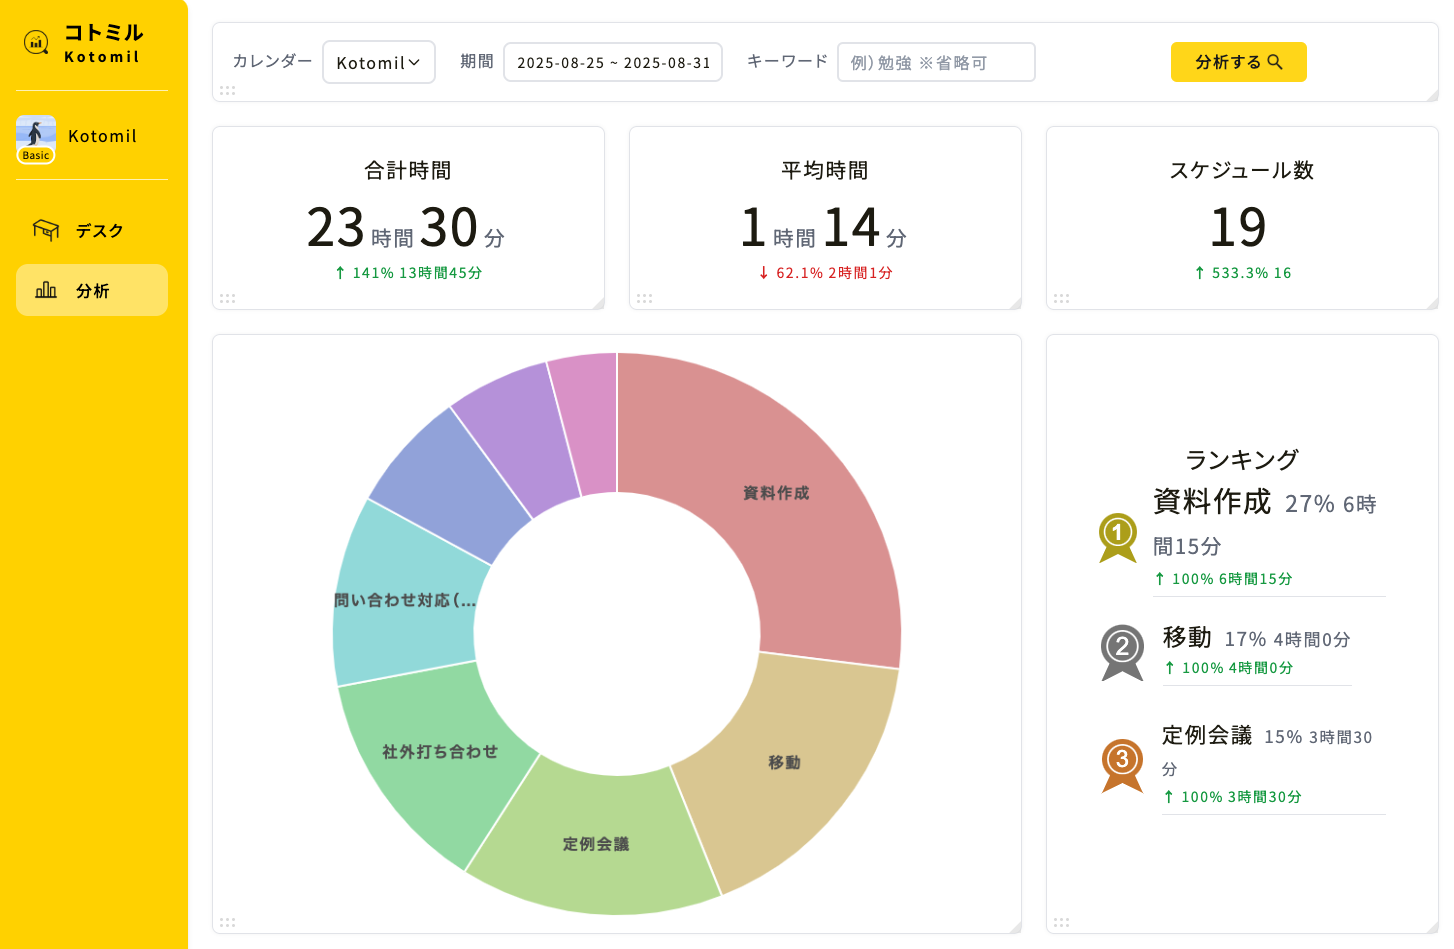
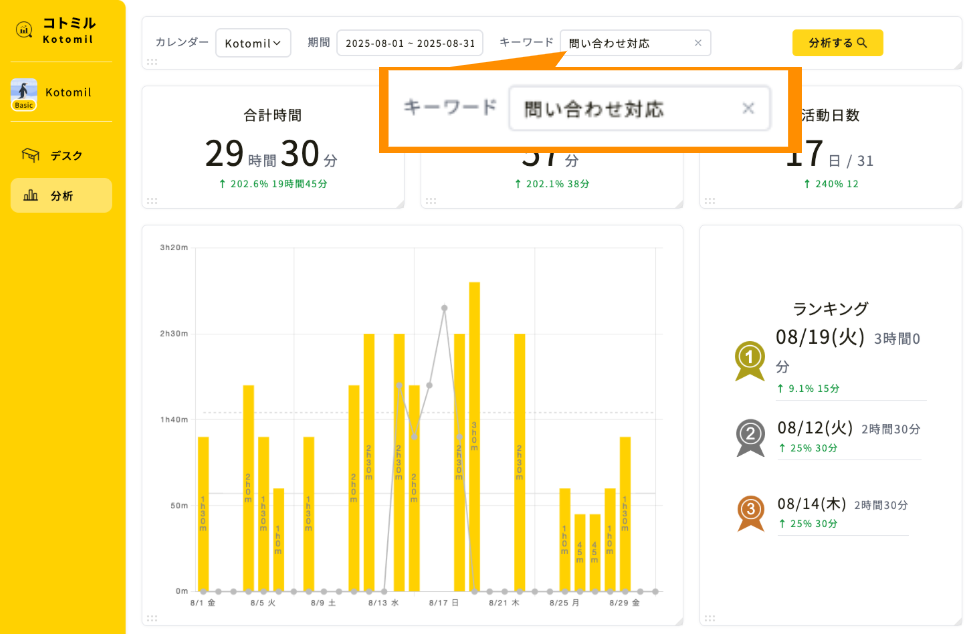
Kotomil connects with Google Calendar and Outlook Calendar to visualize the events you have recorded. Use a selected period to compare time by activity, then use keyword-based views to examine one category in more detail.
A distribution view can show, for example, that meetings consumed more time than focus work. That does not automatically mean meetings are wrong. It gives you a concrete prompt: which meetings need a shorter agenda, a decision owner, or an asynchronous update instead?
Step 4: Check trends before changing your schedule
One week can be misleading. Trend views help you see whether an activity is truly increasing or was only unusually high once.
Try reviewing keywords such as Meeting, Focus, Admin, or a specific project name. A trend can reveal that focus time drops every month-end, that a project is absorbing more hours than planned, or that administrative work has slowly expanded.
Turn one finding into one schedule change
The best time audit ends with a small experiment. Choose one finding and decide how you will test an improvement next week.
What you notice
One change to test
Meetings take most afternoons
Protect two 60–90 minute focus blocks before booking more meetings.
Admin work appears throughout the day
Batch routine messages and administration into one daily block.
Client preparation runs long
Create a reusable checklist and compare the next two weeks.
Important work is constantly interrupted
Move notifications and quick requests to a defined response window.
Keep the experiment specific enough to evaluate. “Be more productive” is difficult to review; “hold Tuesday morning for proposal work” is observable in the next calendar audit.
A 15-minute monthly work-time review
Select the previous month in your calendar analytics.
Compare meetings, focus work, communication, and administration.
Choose one trend that helped or hurt your work.
Write one scheduling rule for the next month.
Review the effect at the end of the next month.
This process works for individual contributors, managers, freelancers, and anyone who wants a calmer, more intentional workweek. The objective is not maximum utilization—it is to reserve time for work that matters.
Frequently asked questions
Should I log every email and short interruption?
No. If interruptions are a concern, use one broad label such as “Communication” or “Reactive work.” The audit needs useful patterns, not perfect surveillance.
How long should a calendar time audit take?
Start with 10 to 15 minutes each week. A short review you repeat is more valuable than a detailed review you abandon after one month.
Make work time visible before trying to optimize it
Finding wasted time at work starts with evidence, not assumptions. Record a few consistent categories, review a completed week, visualize the pattern, and test one change. Over time, your calendar becomes a practical feedback system for protecting focus and improving how work gets done.
See where your time goes from your calendar at a glance📊🔍
With Kotomil, just connect Google Calendar to see how much time you spend on each area in charts and lists. It also helps you find what is making you busy and where your time is becoming unbalanced.